Mapping the connections between places in your data reveals new insights.
Information transcends geography. Analyzing geospatial data with Graphext reveals subtle connections between places around the world. Explore geographic networks with analysis types to map routes, plot points and group locations with similar characteristics. Location Intelligence projects at Graphext enrich, extract and visualize geographic data to present the defining characteristics of cities, countries and related continents.
Projects

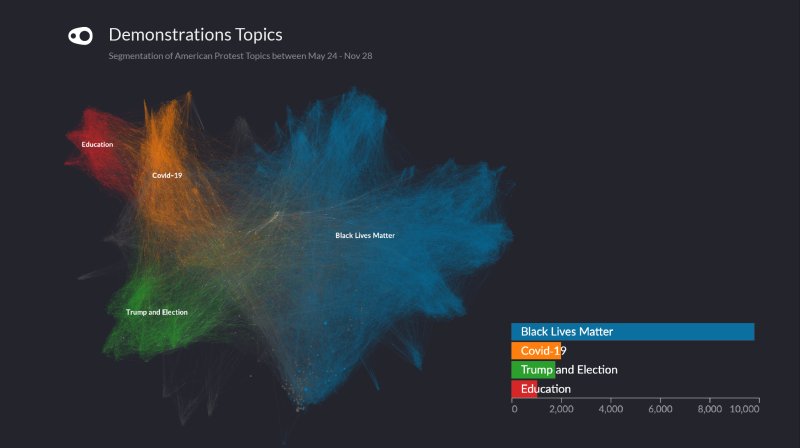
Evolution of the U.S. protests after the death of George Floyd: COVID-19, BLM and the elections.
2020 has been a turbulent year for all countries, but particularly in the US. We grouped U.S. protest events between May 24 and November 28, 2020 to investigate the relationships between types of protests, their violence, and their geography.

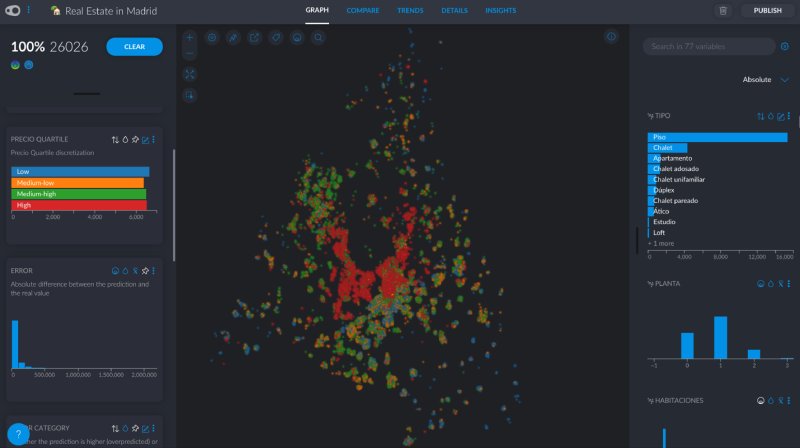
Find Real Estate Opportunities in Madrid
We analyzed over 20,000 listings on real estate websites to try to find low priced homes with Graphext’s predictive algorithms. Along the way, we analyzed the relationships between prices and factors such as education level or location index to try to find insights and patterns in the data.

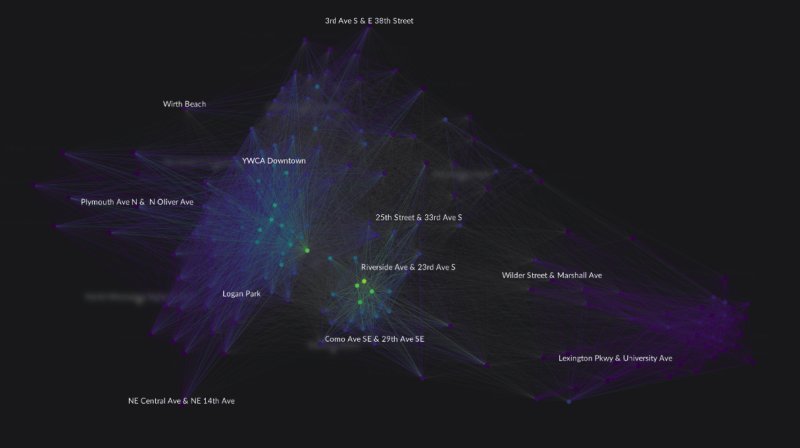
Overcoming distribution challenges with bikesharing
With Graphext we analyzed vehicle distribution data (from Kaggle) from a Minnesota-based bike sharing service to try to understand the bike shortage in Madrid.


