Modeling of clinical or patient data exposes hidden and unexpected variations.
Healthcare professionals operate in a world of tight margins where data-driven decision making is crucial. Our powerful algorithms analyze clinical and patient data to expose significant abnormalities, classify patients and detect patterns that emerge over time. With Graphext, clinicians, academics and clinicians can use network visualizations, predictive modeling and clustering analysis to inform and drive their research.
Projects

The method behind our investigation of adverse event reports of the COVID-19 vaccine.
In undertaking research on adverse reactions associated with the launch of COVID-19 vaccination in the U.S., our team was aware of the increased need for transparency while conducting our analysis. This article documents the methodology behind our study of Vaccine Adverse Event Reporting System (VAERS) data.

Conspiracies, complexity, and clustering: investigating adverse event reports of the COVID-19 vaccine.
Modeling data from the Vaccine Adverse Event Reporting System (VAERS), a U.S. government-sponsored vaccine reaction monitoring service.

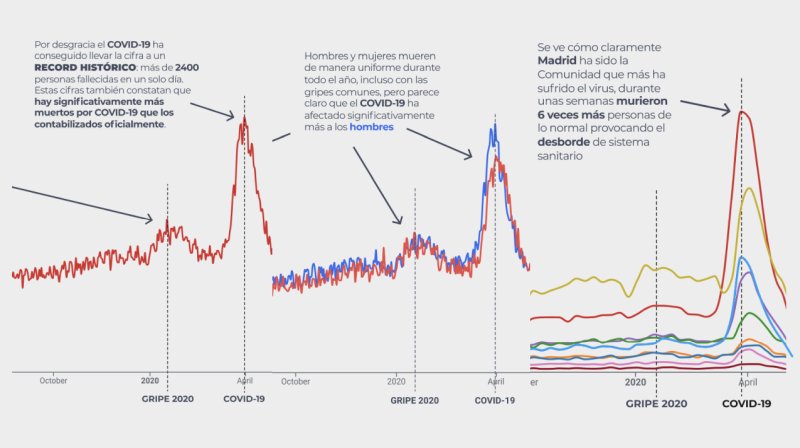
COVID-19 death toll in Spain in context.
Who are and where are the excess deaths in Spain in recent years by age, sex and Autonomous Communities?


